http://www.crh.noaa.gov/images/grr/aviation/airports/btl/BTLCeiling.png
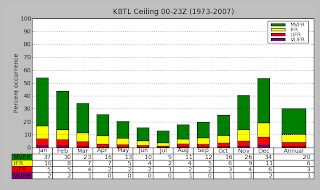
Histograms are a great way to depict data, there are horizontal or vertical histograms. Histograms are similar to bar graphs but usually have connected bars, though this one from NOAA does not.

No comments:
Post a Comment