
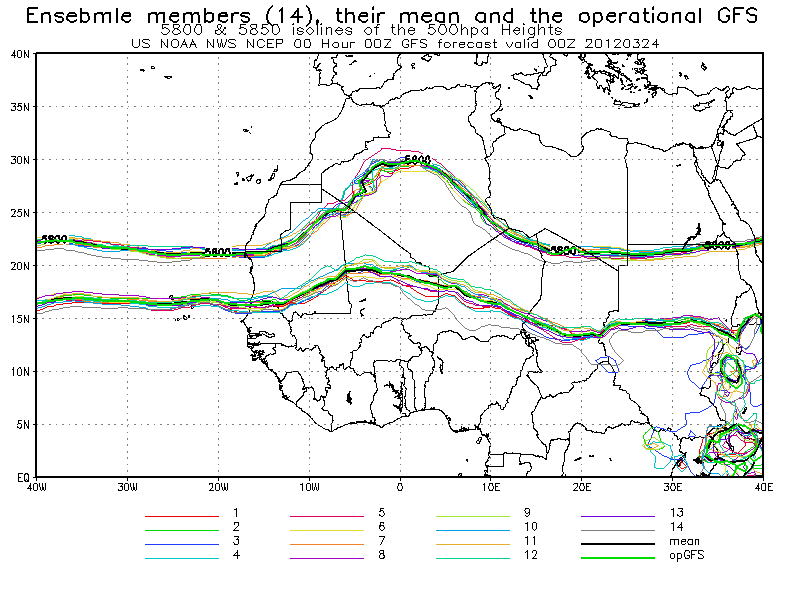
This is a map from NOAA depicting the African Monsoon Multidisciplinary Analysis ensemble forecast 500mb Spaghetti plots (5800, 5850 isolines). An isoline is a curve along a function of a constant value, in cartography the contour line joins points of equal elevation above a given level. This map shows 5800 and 5850 isolines at 500 hpa Heights.
No comments:
Post a Comment