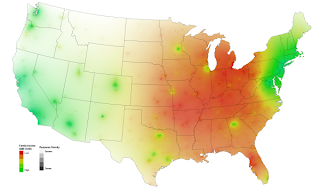
This map shows family income (particular theme) measured in 2008. The color intensity determines the density of a specific area, meanwhile clusters can be seen in certain geographic areas. These clusters can be formed by large cities, or neighborhoods with underlying sociological and economic circumstances that increases the chances of their income being the same within that specific location. It is also important to remember that the data collected from individuals has been summarized into 5 specific color ranges, this leaving some information out. Thematic maps can portray a wide arrangement of information in a variety of subjects such as physical, social, political, cultural, economic, sociological, agricultural, etc. and can be ranged from a city, state, region, nation, or continent.
No comments:
Post a Comment