Wednesday, November 23, 2011

Histogram

http://www.crh.noaa.gov/images/grr/aviation/airports/btl/BTLCeiling.png

Histograms are a great way to depict data, there are horizontal or vertical histograms. Histograms are similar to bar graphs but usually have connected bars, though this one from NOAA does not.

Correlation Matrix


The correlation matrix is used to see population correlations and sample correlations through standard deviations. 
It is also known as a covariance matrix. 

Similarity matrix


Similarity matrix are used in sequence alignment, a way of arranging a sequence such as DNA or RNA paring. 

Parallel Coordinate Graph

http://andrewgelman.com/2007/10/parallel_coordi/

Parallel coordinate graphs are useful for comparing two variables within a graph.

Windrose

http://www.wcc.nrcs.usda.gov/climate/windrose.html
Windroses are maps in a circular format, this windrose shows the frequency of winds blowing from certain directions and the the frequency of time the wind blows from a particular direction. Each circle represents a different frequency, other information such as directions (North, South, East, West) can also be shown since the windrose map originated from the compass.
http://inquiry.net/outdoor/skills/b-p/compass.htm

http://www.crh.noaa.gov/images/grr/aviation/airports/btl/BTLSpringRose.png
This shows a wind rose of data from Spring time, March-April. A wind rose is a diagram that depicts wind direction and speed distribution at a location over  a period of time. The length of the spoke indicates how often the wind comes from that direction, longer spokes mean the wind comes from the direction more often while shorter indicates less frequency. The dotted ring labels indicate the percentage while the colors display how often the wind speed falls within a given range of speed.

Star Plot

http://office.microsoft.com/en-us/excel-help/present-your-data-in-a-radar-chart-HA010218672.aspx
Star plots can display various observations with an arbitrary number of variables. The observations are displayed in a star-shaped manner with a ray for each variable, the length of the ray is proportional to the variable.

Index Value Plot

http://waterwatch.usgs.gov/new/?m=pa07d_dry&w=plot
This map type indicates absolute numbers and values. This map indicates the expected percentage of stations bellow water level between the years of 2002-2010.

Bilateral Graph

http://seekingalpha.com/article/241440-will-october-s-improved-trade-deficit-continue

The Bilateral graph compares two different items at the same time. Relationships of rises and lows can easily be seen as well as other comparisons useful for practical applications and the gathering of information.

Accumulative line graph or Lorenz curve

http://people.hofstra.edu/geotrans/eng/ch4en/meth4en/gini.html

Accumulative line graph shows the proportionality of a distribution. They elements are ordered from most important to least important, and plotted based on their percentage, then compared to the perfect equality line.
http://pubs.usgs.gov/circ/2007/1294/paper1.html

Tuesday, November 22, 2011

Scatter Plot

http://itl.nist.gov/div898/handbook/eda/section3/eda33q.htm

A scatter plot distributes data across an equal breaks scale, this can either depict a trend or not. This data can be seen that as the in-lab crack size reading increases, so did the in-field readings.

Triangular Plot

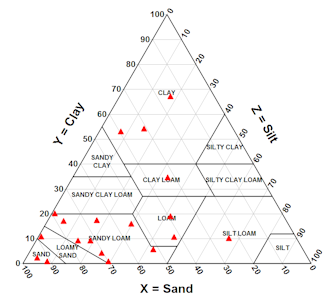
http://www.dplot.com/triangle-plot.htm

This triangular plot overlaps clay with silt and sand percentages in a soil texture analysis. This information is useful for USDA especially within different regions and soil compositions. The Triangular plot makes the comparison more evident.

Climograph

http://www.srh.noaa.gov/bmx/?n=bhmclimograph

Climographs are extremely pertinent to weather prediction centers, local weather stations and research. Climographs show monthly precipitation, maximum and minimum temperature, the average temperature in Birmingham, Alabama. The most important correlation is that temperature is compared to precipitaiton.

Digital Raster Graphic (DRG)

http://topomaps.usgs.gov/drg/

 DRGs are a digital image that results from scanning a paper, USGS topographic maps can be used on computers once they become DRGs such as the map shown above. 

Digital Line Graph (DLG)

http://spatialnews.geocomm.com/whitepapers/usgs_dlg.pdf
DLG is a cartographic map feature represented in a digital vector form distributed by USGS. DLGs are collected from USGS maps and distributed in different sizes, with scales with various categories of features depending on the scale. This import of USGS DLG data is showing contours, roads, section lines, lakes and streams from a portion of the  collected data.

Dot Distribution

http://www.census.gov/geo/www/mapGallery/images/2k_night.jpg
This dot distribution map was taken in 2000, showing the population distribution in the USA, the scale is one dot=7,500 people. The data collection was done by the 2000 Decennial Census, a part of the US Census Bureau.

Box Plot

Box plots display quantitative data, they are older types of maps but are still used today. They are useful because they show average tendencies, making them especially useful for basic math principles such as upper and lower confidence intervals, and outliers.

Stem and Leaf Plot


Stem and Leaf plot shows the number of students heart rates after one minute of jumping jacks. The stem is the number to the tens, so 15 in the stem section means 150, to that you add one of the number in the leaf section, 1 so the number is 151. Repeated numbers are more than one student. This map is useful for finding mathematical data such as the mean, median, and mode.

Range Graded Proportional Circle Map

The proportional circle map depicts the circles in relation to ranges of data, in various locations. The information is classified as spatially, it could also be equal quantiles, breaks, natural breaks, and minimum variance.

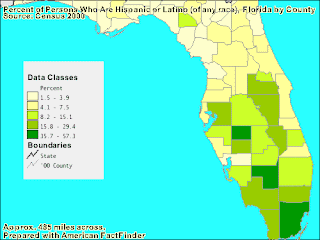
Range Graded Chloropleth Map

This map is divided into 5 natural breaks so the groups are divided into groups of data that are not equally sized to attempt to group data together, this depicts the color in relation to ranges of data.

Unclassed Choropleth Maps

The map above is not classified, you could perhaps say the scale is high or low, however there is no scale on this map. The Water Management Districts of Florida have split the map into regions where the each of the 5 water management districts rule. The reason for the different regions, such as water source, quality, and quantity is not shown in this unclassed choloropleth map.