Tuesday, November 22, 2011

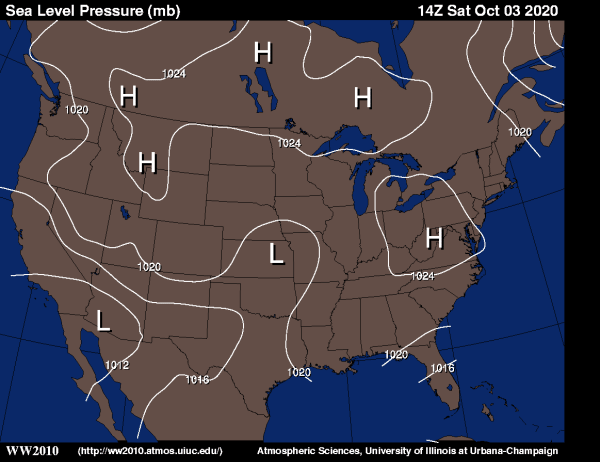
Isobar Maps

http://ww2010.atmos.uiuc.edu/%28Gh%29/wx/cwp/prods/current/sfcslp/sfcslp_N.gif


Isobar maps shows lines of equal pressure on a map through an isopleth (contour line), isobars are lines drawn on a map joining places of equal average atmospheric pressure reduced to sea level for a specific period of time. This map shows the prediction for Wednesday, November 23rd, 2011 which is the present situation. Currently the North east is under low pressure while the southwest has high pressure and changing again to low pressure in Mexico.

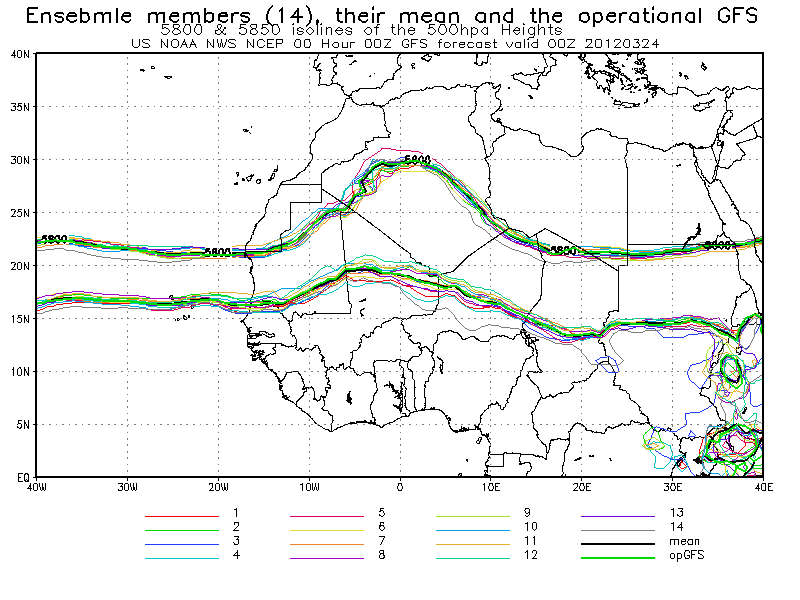
Isoline Map

http://www.cpc.ncep.noaa.gov/products/african_desk/amma1/day0/00/00_ensm_spa_hgt500a.png

This is a map from NOAA depicting the African Monsoon Multidisciplinary Analysis ensemble forecast 500mb Spaghetti plots (5800, 5850 isolines). An isoline is a curve along a function of a constant value, in cartography the contour line joins points of equal elevation above a given level. This map shows 5800 and 5850 isolines at 500 hpa Heights.

Historical Topographic Maps


This type of map has been effective in portraying the complex geography of the USA. Before 2009, USGS topographic maps were created using traditional cartographic methods and printed using a lithographic printing process. This type of map is characterized by large-scale detail and quantitative representation of relief, in this case, using contour lines.

Hydrographic Maps

http://nationalmap.gov/hydro.html

This map shows water bodies and water ways along the Missouri River. It is important for water management as well as district planning. Water can be a vary valuable resource and asset to the land since for development to prevail there must be water available, thus this map can be extremely variable and when using it for mapping property it is of utter importance that it is accurate because little changes to the map can have large impacts when applicable to real life. There is more data on surface water in the US from USGs in the National Hydrography Dataset (NHD). The NHD has data covering all streams and lakes with a scale of 1:24,000 and 1:100,000 which provides a network helpful for the analysis of any type of movement of surface waters, whether it be due to navigation, erosion, sediment transport, or effluent dispersion as some examples.

Digital Ortho Quarter-Quads (DOQQ)

Color Infrared 1998: Part of Flowers NE (Johnston County)

Black & White 1993: Part of Flowers NE (Johnston County)
http://www.lib.ncsu.edu/gis/doqq.html
This is a Digital Ortho Quater-Quads, aerial images produced by USGS and contain orthorectified aerial photography at a resolution of 1 meter. This shows examples of a color infrared and a black and white photo. While the colored was taken in 1998, the black and white was taken in 1993 which is helpful in comparing the pictures, especially for an agency such as the EPA in order to determine erosion, deforestation, development, or water movement over time. 


Planimetric Map

http://seamless.usgs.gov/

This map is an aerial photography that shows visible features of the land. Streets, houses, pools, parking lots, boats, trees, open space, and water ways can be seen. This type of map can be used for planning, land use, and zoning. It may also have other useful purposes such as directions or real estate utility. This type of map is similar to what can be seen from Google Earth. 

Contour

http://nationalmap.gov/elevation.html

This map shows the contour of the elevation of the land. This type of map can also be classified as a  Digital Elevation Model (DEM) as part of the National Elevation Dataset (NED). The NED provides dataset from raster elevation data. As part of the USGS, it provides information and maps for the US, Alaska, Hawaii, and US territories. Not only are these maps updated on an average of two months, but they are also public domain. This helps provide resources for other maps as well as maintain current maps and higher resolution as technology is improved.