Tuesday, November 22, 2011

Continuously Variable Proportional Circle Map


These maps utilize circles to create data point. The clear circles depict population decrease, while the brown depict a population increase. The size of the circle illustrates the number of people, as is shown by the scale. This map relates the scale to the population of the hispanic and white race in 7 states.

Political Map

http://thesocietypages.org/graphicsociology/

This map shows political affiliation from strong democrat, independent, to strong republican throughout the United States. It is easy to see a trend in a divide between the Democratic North and the Republican South, of course there are further divisions which matter such as state borders since elections are measured by states. This will probably also vary during elections cycles because you can change your affiliation because runner candidates may have a strong influence on your party view.

Thematic Map


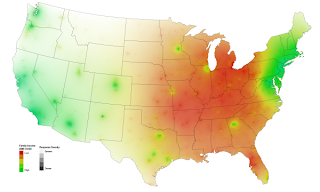
This map shows family income (particular theme) measured in 2008. The color intensity determines the density of a specific area, meanwhile clusters can be seen in certain geographic areas. These clusters can be formed by large cities, or neighborhoods with underlying sociological and economic circumstances that increases the chances of their income being the same within that specific location. It is also important to remember that the data collected from individuals has been summarized into 5 specific color ranges, this leaving some information out. Thematic maps can portray a wide arrangement of information in a variety of subjects such as physical, social, political, cultural, economic, sociological, agricultural, etc. and can be ranged from a city, state, region, nation, or continent.

Zone Map

http://www.garden.org/zipzone/index.php?img=nwusa
This map separates the USA into temperature zones. This is useful for homeowners, agriculture, and USDA because gardeners can know what plants are more adaptable to the region they are from according to the temperature range they are known to grow the best.

Flow Map

http://www.lib.washington.edu/uwill/cycle/sociology/
A flow map shows movement of objects or ideas from one location to another, and they may form a network. This interconnected flow map pyramid demonstrates how information produced by sociological research tends to flow in a certain direction (depicted by the arrows).


Isopleth Map


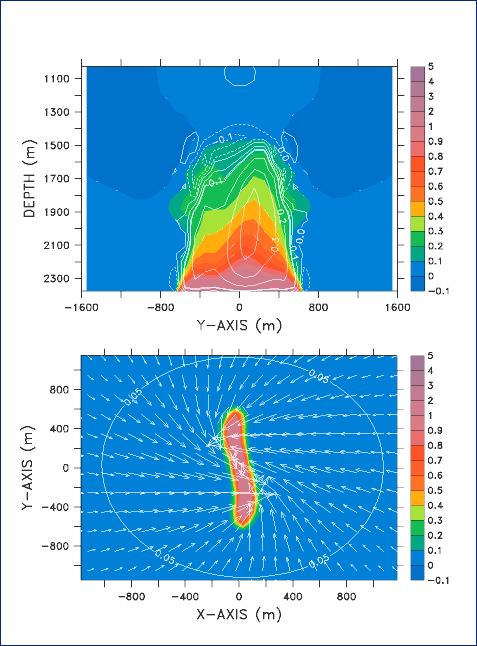
This 3-Dimensional numerical model addresses the circulation and plume development from a line segment source of magma events at the sea floor, which can quickly and suddenly release heat to the ocean. The line contours are vertical velocity isopleths in m/s showing thermal anomalies, vectors are caused by the Earth's rotation. The isopleth map generalizes and simplifies data with a continuous distribution and illustrates it as a third dimension within a map. Isopleths can also be used for mapping surface elevation, precipitation, atmospheric air pressure or any other measurements that can be viewed statistically in a third dimension.

Isopach Map


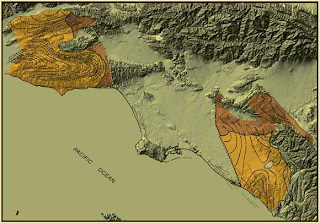
An Isopach map illustrates the thickness variation within a tabular unit, like other map types, Isopachs have contour lines of similar thickness over an area. They are extremely useful for geologists and geographers because they are used for hydrographic surveys, sedimentology, volcanology, etc. This map is from 2004 Los Angeles Basin, California. The mapped margins are of depositional basins of the Sespe-Vaqueros Formations on a shaded elevation map in the area of study.