Tuesday, November 22, 2011
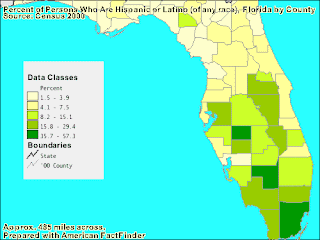
Range Graded Chloropleth Map

Unclassed Choropleth Maps

The map above is not classified, you could perhaps say the scale is high or low, however there is no scale on this map. The Water Management Districts of Florida have split the map into regions where the each of the 5 water management districts rule. The reason for the different regions, such as water source, quality, and quantity is not shown in this unclassed choloropleth map.
Hypsometric Map

This map shows elevation accentuated by hypsometric colors despite the fact that the colors do not consider the dry vegetation of Egypt. The color also adds to the accentuation of elevation.
Propaganda Map

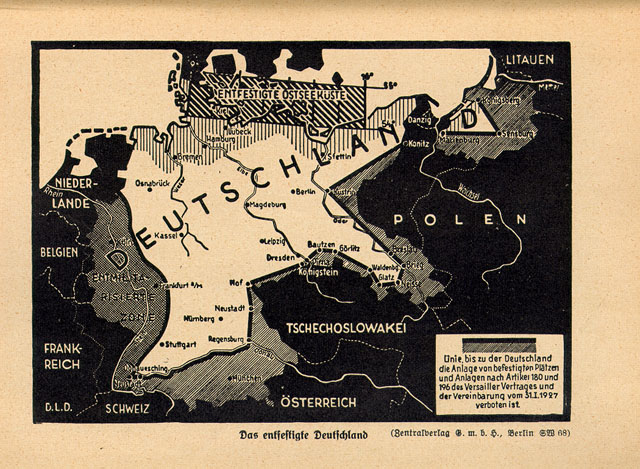
The map is titled “Demilitarized Germany,” the shaded areas are regions demilitarized under the Treaty of Versailles, this map can be used for the West to show that Germany can be trusted or it can be propaganda from the West to show its power and that Germany is close to being conquered.

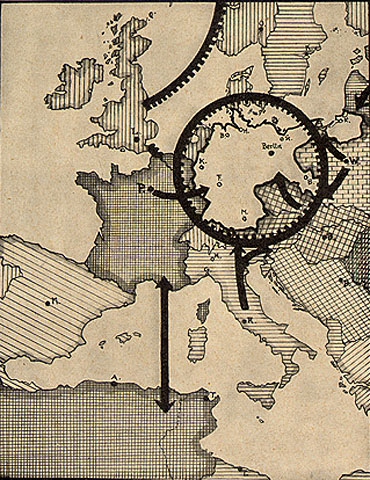
The caption says: “With an insufficient military, Germany can be blockaded both by land and sea.” This map depicts that under the Allied blockade in World War I, Germany had suffered considerably, this map is a propaganda suggesting that this could happen again.

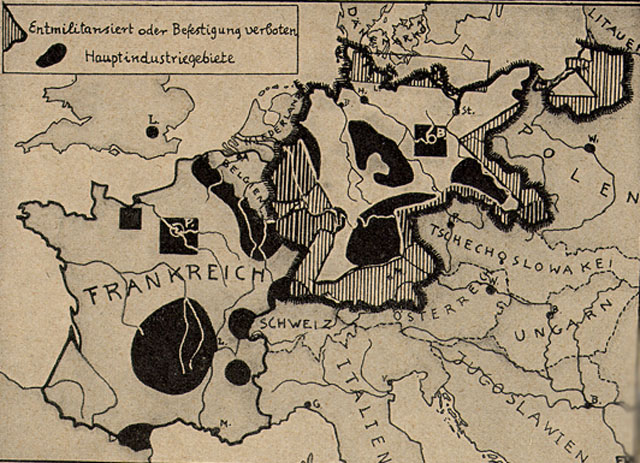
The black areas are industrial zones. The caption reads: “Germany’s industrial areas, unlike those of France, are defenseless in defortified or even demilitarized border zones.” Once again, another persuasive, propaganda map. Propaganda maps can also be political propaganda or advertisement or journalistic cartography.
Cartogram


Public Land Survey System (PLSS)
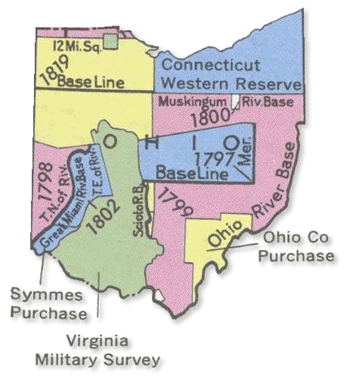
The Public Land Survey System (rectangular survey system) surveys and identifies land parcels; either public or for titles and deeds of rural, wild, or undeveloped land. The units of area within this map is the township and section by year of the establishment of the border.
Subscribe to:
Posts (Atom)