http://www.wcc.nrcs.usda.gov/climate/windrose.html
Windroses are maps in a circular format, this windrose shows the frequency of winds blowing from certain directions and the the frequency of time the wind blows from a particular direction. Each circle represents a different frequency, other information such as directions (North, South, East, West) can also be shown since the windrose map originated from the compass.
http://inquiry.net/outdoor/skills/b-p/compass.htm
http://www.crh.noaa.gov/images/grr/aviation/airports/btl/BTLSpringRose.png
This shows a wind rose of data from Spring time, March-April. A wind rose is a diagram that depicts wind direction and speed distribution at a location over a period of time. The length of the spoke indicates how often the wind comes from that direction, longer spokes mean the wind comes from the direction more often while shorter indicates less frequency. The dotted ring labels indicate the percentage while the colors display how often the wind speed falls within a given range of speed.
Wednesday, November 23, 2011
Star Plot
http://office.microsoft.com/en-us/excel-help/present-your-data-in-a-radar-chart-HA010218672.aspx
Star plots can display various observations with an arbitrary number of variables. The observations are displayed in a star-shaped manner with a ray for each variable, the length of the ray is proportional to the variable.
Index Value Plot
http://waterwatch.usgs.gov/new/?m=pa07d_dry&w=plot
This map type indicates absolute numbers and values. This map indicates the expected percentage of stations bellow water level between the years of 2002-2010.
Bilateral Graph
http://seekingalpha.com/article/241440-will-october-s-improved-trade-deficit-continue
The Bilateral graph compares two different items at the same time. Relationships of rises and lows can easily be seen as well as other comparisons useful for practical applications and the gathering of information.
Accumulative line graph or Lorenz curve
http://people.hofstra.edu/geotrans/eng/ch4en/meth4en/gini.html
Accumulative line graph shows the proportionality of a distribution. They elements are ordered from most important to least important, and plotted based on their percentage, then compared to the perfect equality line.
http://pubs.usgs.gov/circ/2007/1294/paper1.html
Accumulative line graph shows the proportionality of a distribution. They elements are ordered from most important to least important, and plotted based on their percentage, then compared to the perfect equality line.
http://pubs.usgs.gov/circ/2007/1294/paper1.html
Tuesday, November 22, 2011
Scatter Plot
http://itl.nist.gov/div898/handbook/eda/section3/eda33q.htm
A scatter plot distributes data across an equal breaks scale, this can either depict a trend or not. This data can be seen that as the in-lab crack size reading increases, so did the in-field readings.
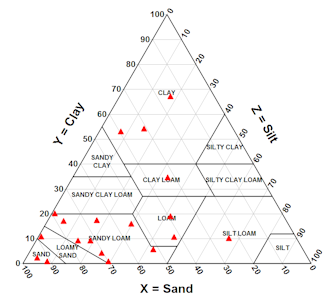
Triangular Plot
http://www.dplot.com/triangle-plot.htm
This triangular plot overlaps clay with silt and sand percentages in a soil texture analysis. This information is useful for USDA especially within different regions and soil compositions. The Triangular plot makes the comparison more evident.
Subscribe to:
Posts (Atom)